Planning
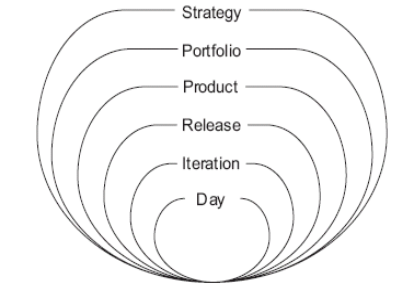
Planning Onion (Level of Planing)
In agile development, there are multiple planing cycles, each being longer than the previous one. Agile teams plan at the innermost three levels
Choosing a User Story
To choose a user story multiple factors should be looked:
- value for the end user
- financial value the feature provide
- Internal Rate of Return (IRR)
- Net Present value
- the cost of developing the feature
- the knowledge gained by developing the feature
- the risk associated with the feature
- scheduling risk (the feature might not be done until April)
- cost risk (the feature might cost a lot more)
- functionality risk (the feature might be unfeasable)
Story Points
Story points doesn't have a unit. One story point is the amount of work for a reference user story.
Estimating
When estimating, as the amount of effort increases the accuracy doesn't necessarily increases. An agile team should stay on the left side of the curve.
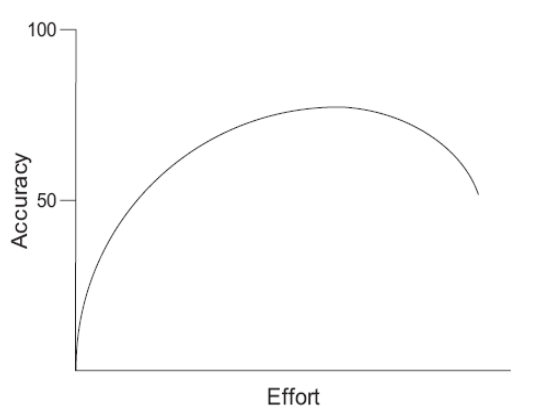
Also, an estimate is a range (eg. between 2 and 5 days), not an exact number and not a commitment.
The user stories should be estimated by the team without the product owner. The teams should be aware of that the estimates are crude.
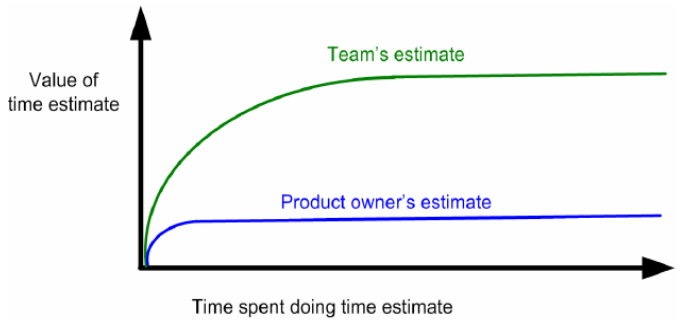
A team should re-estimate a user story when its relative size has changed.
Planning Poker (Techniques for Estimating)
In planing poker, everybody gets cards with the possible story points. The available cards can either be the Fibonacci numbers or \(2^n\) (1, 2, 4, 8, ...), but not continuous numbers (1, 2, 3, 4). Additionally, 0 should not be a valid number, as ten tasks with 0 will probably take longer then \(10\cdot 0=0\).
For user story, the range of available cards should be in the range of \(1-10\). For epics and themes 13, 20, 40 and 100 should be added to the list of available cards.
- Each estimator is given a deck of cards, each card has a valid estimate written on it
- Customer/Prodct owner reads a story and it's discussed briefly
- Each estimator selects a card that is their estimate
- At the same time, all estimator reveal their card
- The differences should be discussed, especially outliers
- Re-estimate until the score converge
Iteration Planing
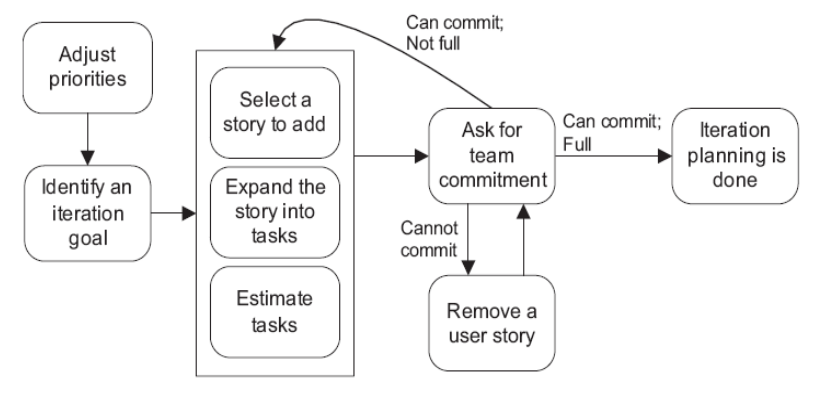
The chart above shows how user stories are added to a sprint. Importantly, the team has to commit to implementing the feature in that sprint.
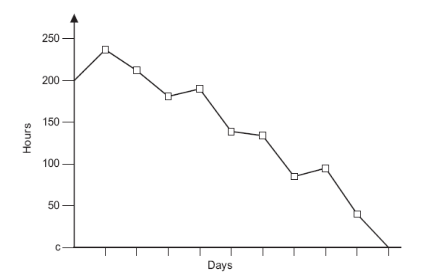
Burndown Chart
The burndown chart represents the story points left in the current sprint.
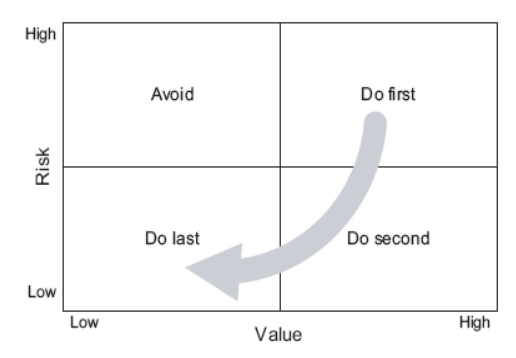
Prioritising
When prioritising user stories, different metrics can be used:
- The financial value of having a feature
- The cost of developing and supporting a new feature This is more or less equal to the story points
- The amount of knowledge gained by developing the feature
- The amount of risk removed by developing a feature
Kano Model of Customer Satisfaction
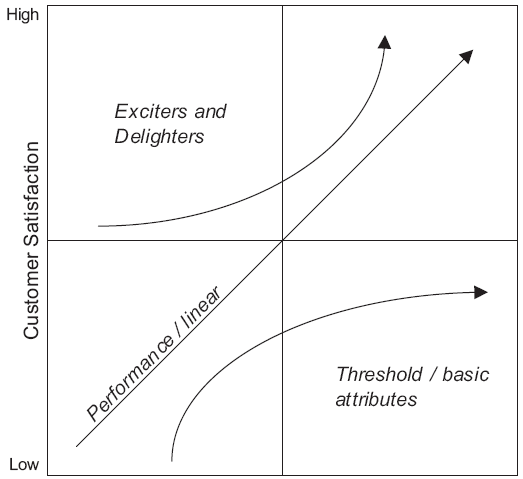
- Threshold/basic attributes are must-have features (the mvp of a product)
- Performance/linear are features for which "the more-the better" holds (more levels in a game)
- Exciters and delighters: are features which provide a great customer experience, but come at a price premium (Example: Great graphics in a game)