Clustering
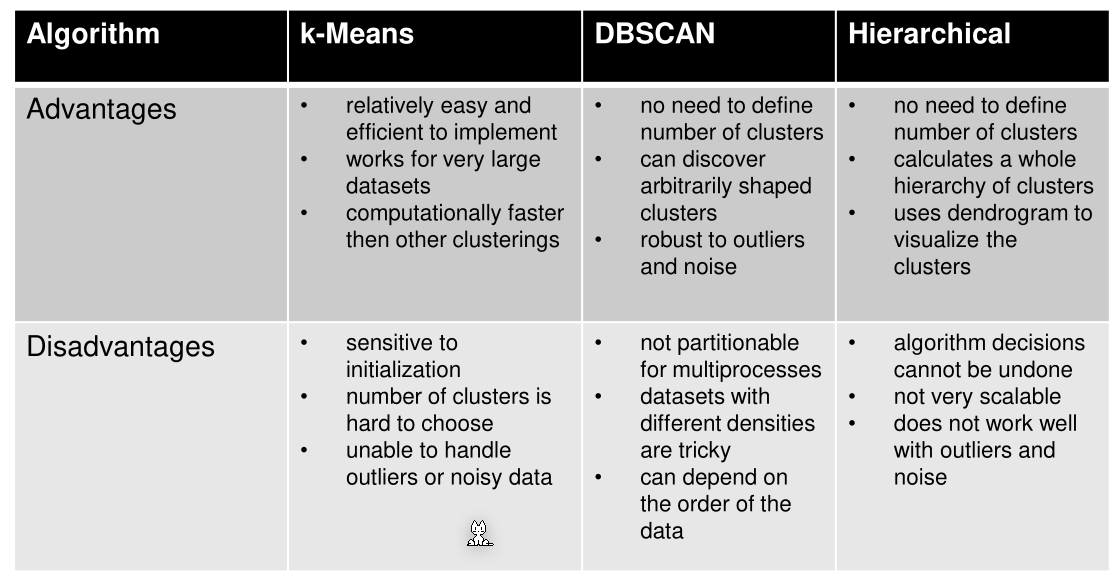
The following table compares different algorithms:
Silhouette Coefficient
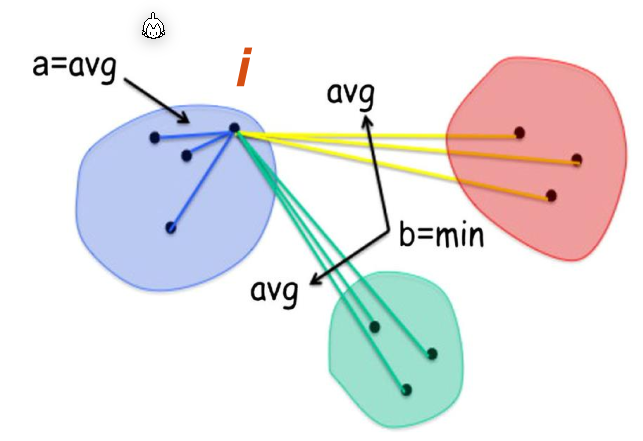
In the following definition \(i\) and \(j\) are data points and \(C_I\) and \(C_J\) are the respective clusters of the data points \(i\) and \(j\). \(d(i, j)\) is the distance between \(i\) and \(j\). $$ \begin{align} a(i)&=\frac 1 {|C_I|-1} \sum_{j\in C_J,i\neq j} d(i,j)\ b(i)&=\min_{J\neq I} \frac 1 {|C_J|} \sum_{j\in C_J} d(i, j)\ s(i)&=\frac{b(i) - a(i)}{\max(a(i), b(i))} &\text{if } |C_I| > 1\ s(i)&=0 & \text{if } |C_I| = 1 \end{align} $$ \(a(i)\) is the average distance to all points in the same clusters as \(i\), while \(b(i)\) is the average distance to all points of the closest neighbouring cluster.
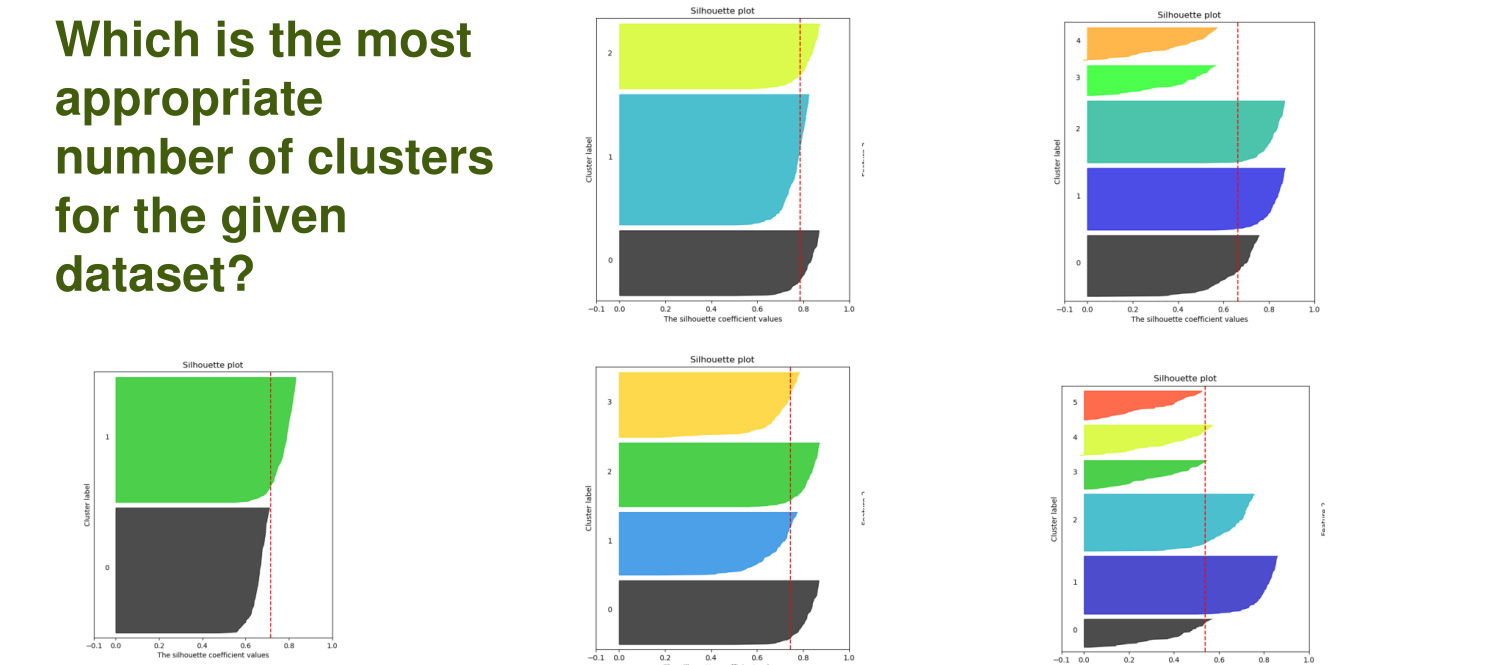
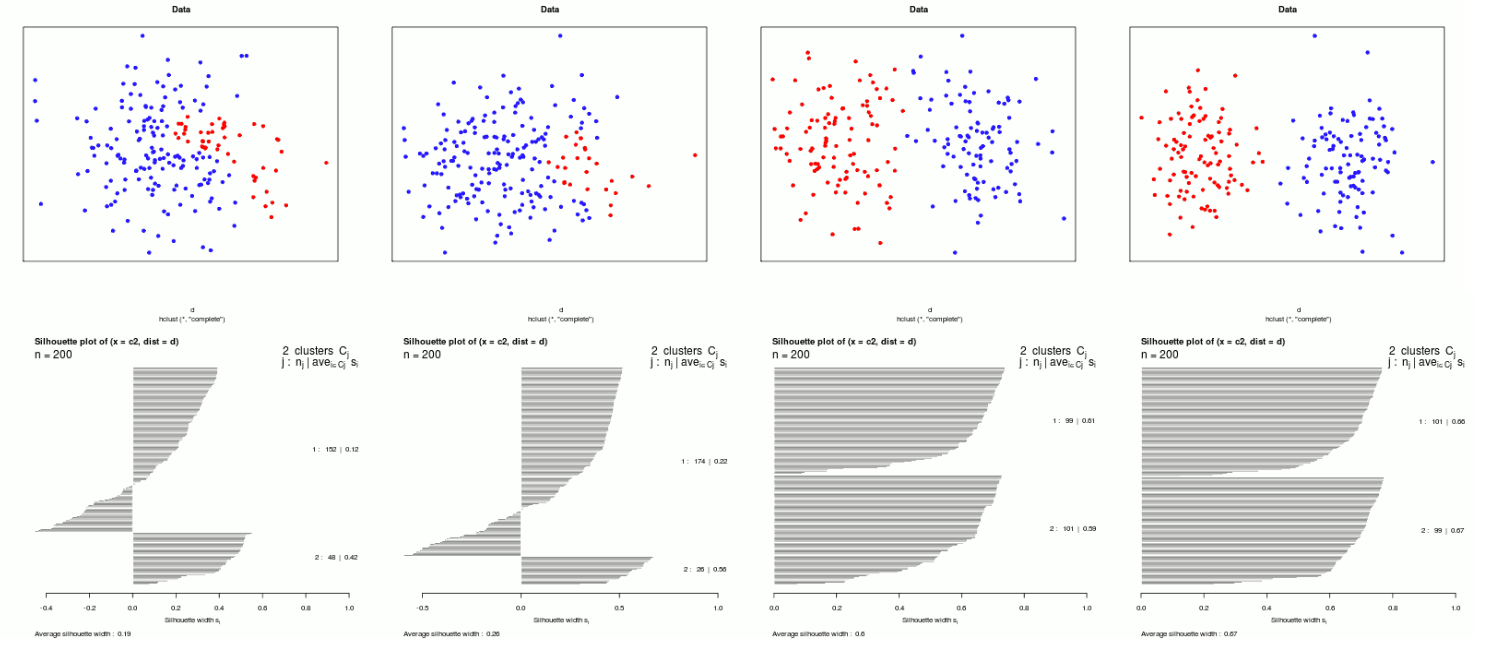
The silhouette coefficient can be plotted into a following diagram. The red line is the overall silhouette coefficient average.
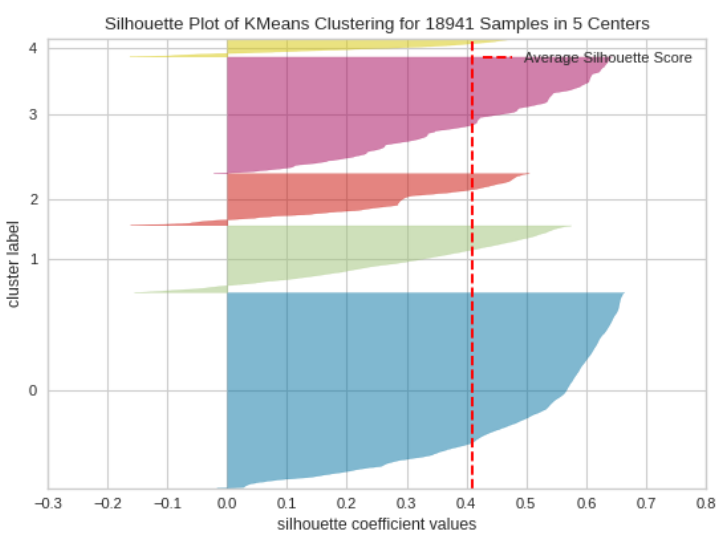
If the silhouette coefficient is less then zero then this point might be wrongly classified.
In the following graphs \(k=3\) or \(k=4\) is best, since they have a height average silhouette coefficient. \(k=4\) has more equally sized clusters which can be a benefit.